Heat Map
Required Project for Data Visualization Certification
Objective: Visualize Data with a Heat Map
Must use D3.js to build this project. Use whichever libraries or APIs needed. Give it your own personal style.
Project Requirements:
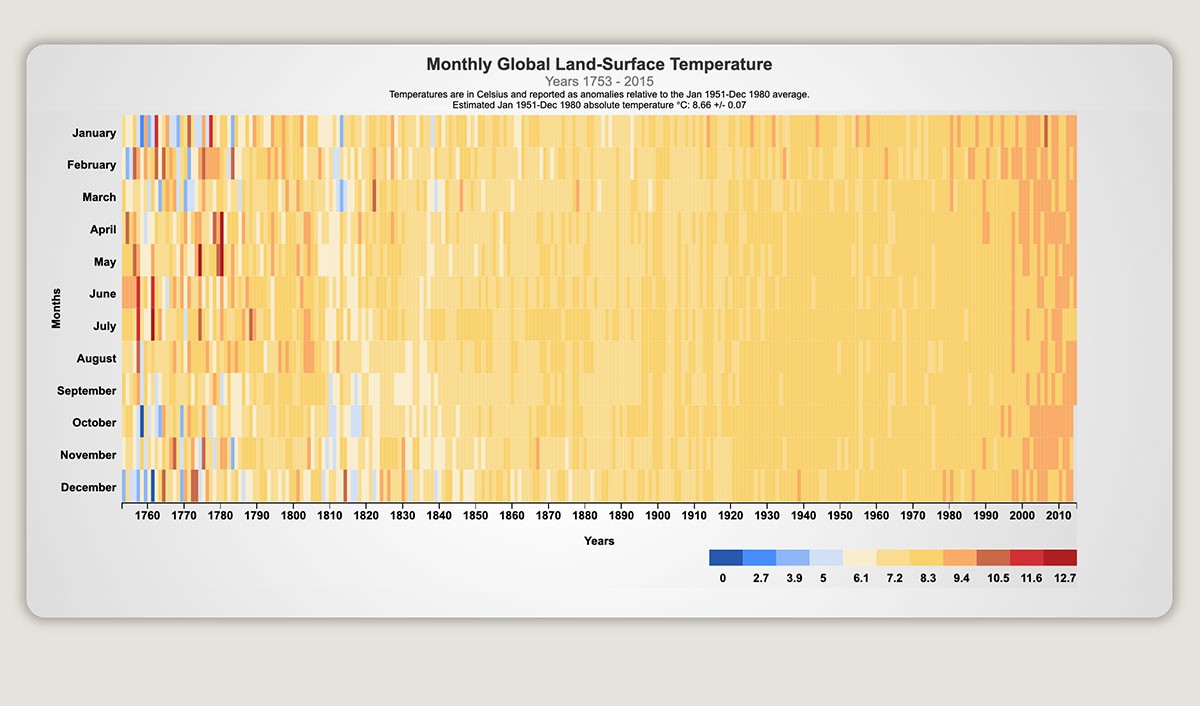
- Can view a heat map with data represented both on the Y and X axis
- Each cell is colored based on its relationship to other data
- Can mouse over a cell in the heat map to get more exact information