TripReview
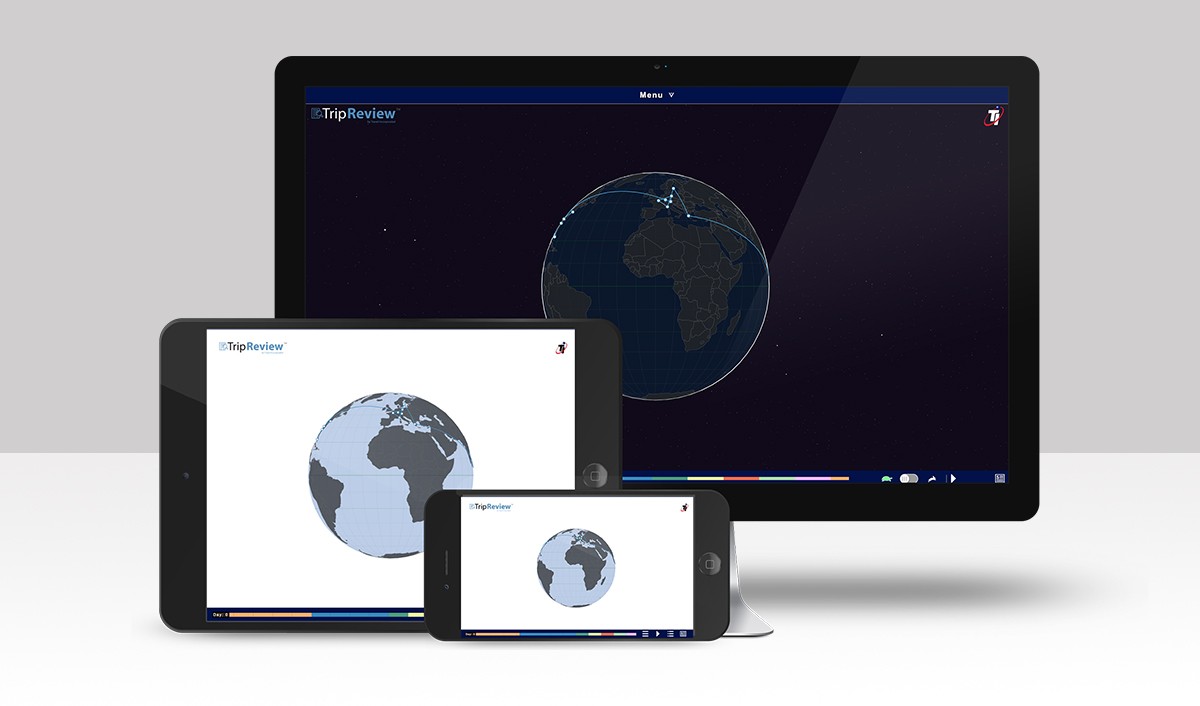
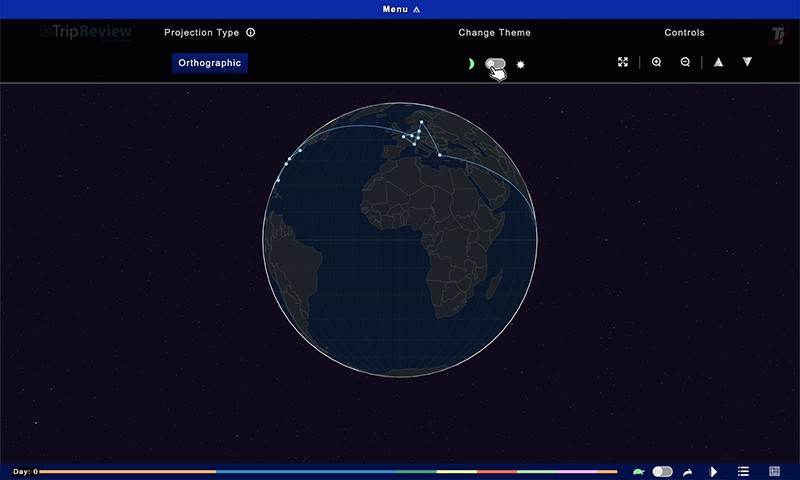
Powered by D3.js, TripReview presents eItinerary travel destinations plotted on a map of the world. Users can choose between 5 map projections, switch themes, view their eItinerary as an animated timeline and view travel expense information.
Technology


Please note that the TI ® logo, trademark, brand and TripReview logo are the sole property of Travel Incorporated ®.
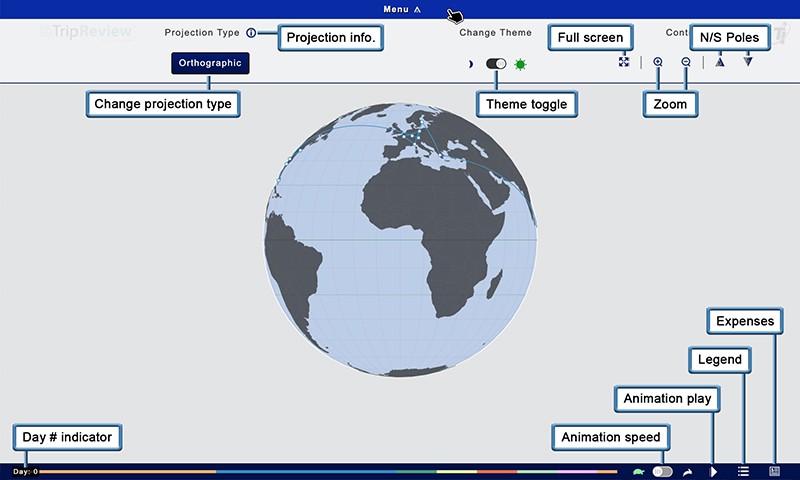
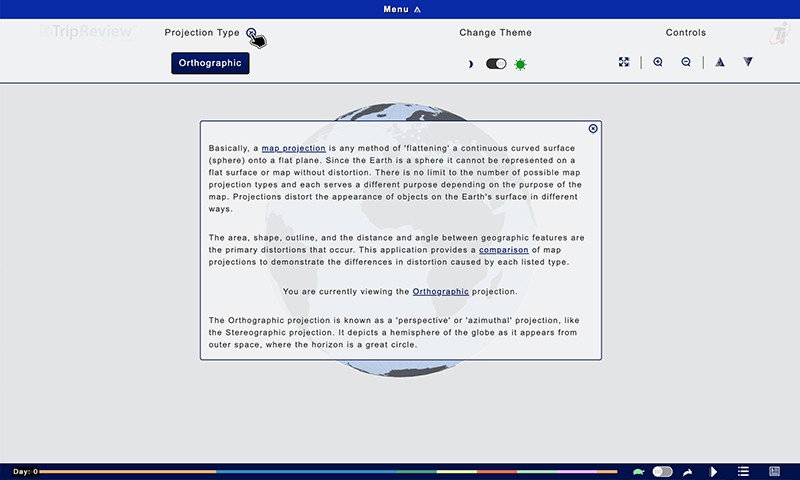
The Projection Type Info. button reveals information about map projections, a comparison link, a link to details and information regarding the current projection being viewed.
The Theme toggle switches between a light and dark theme.
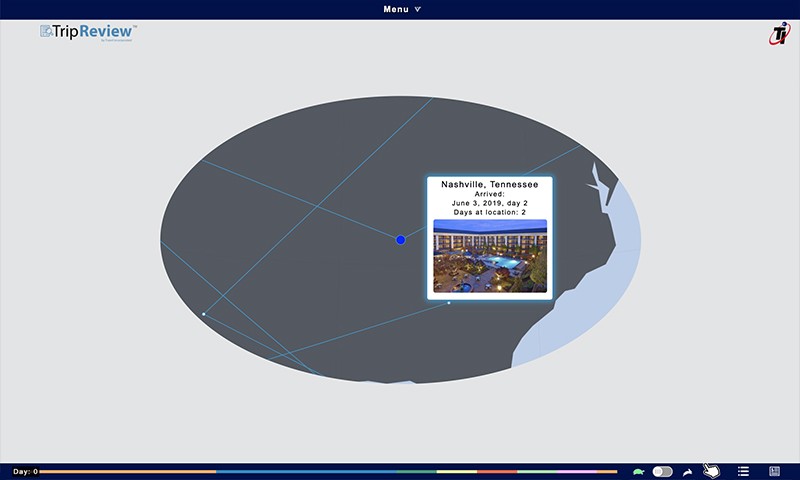
The animation play button initiates an animated timeline of a pre-determined travel period, (demo is set for a month).
The animation displays information about each destination that includes arrival date, days at location and the day number of the travel period.
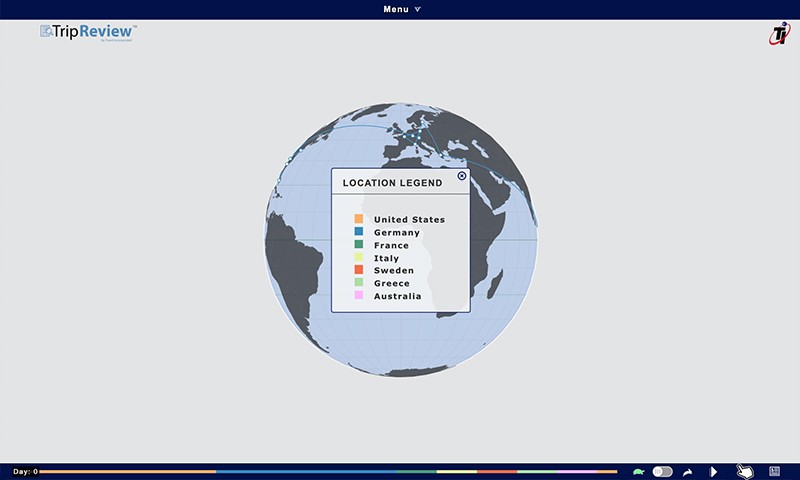
The legend button reveals the color-coded location legend that coordinates with the colors in the animation bar below.
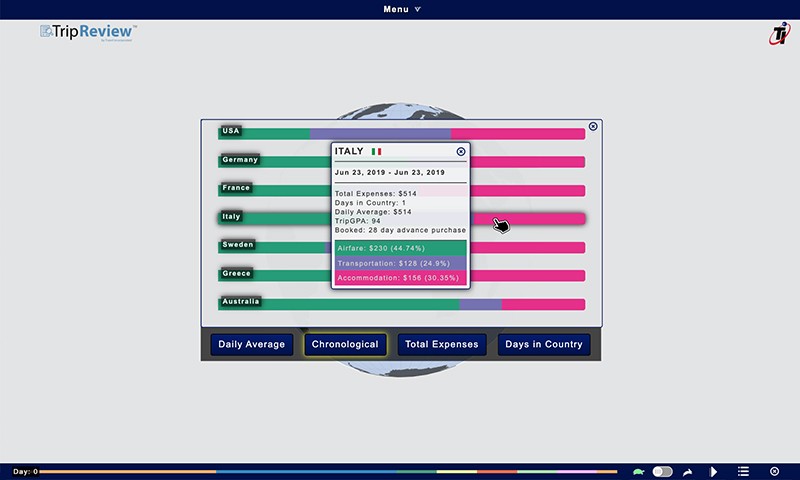
The expenses button displays a travel expense bar graph filterable by daily average, chronological, totals and days in country.
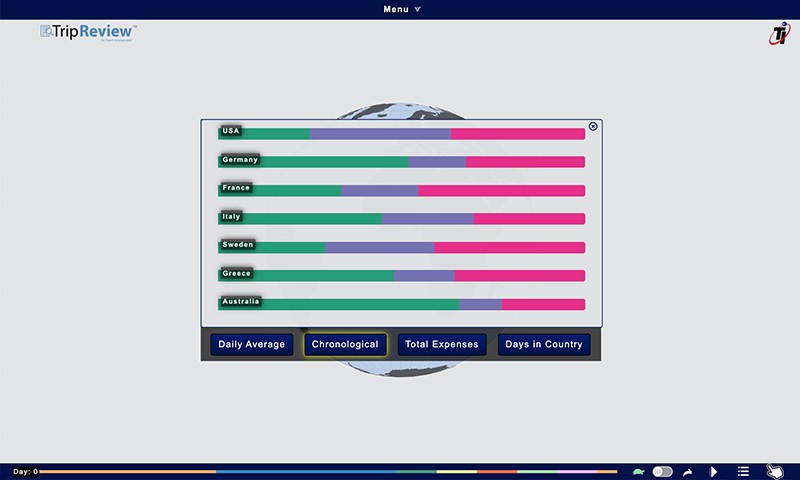
Clicking on a bar displays expense information about that country that includes days in country, daily average expenses, TripGPA score and breaks down airfare, ground transportation and hotels.